Navigating Pint AI: All Creatives
A quick guide to navigating the All Creatives section of Pint AI

Hey there!
Here's a quick breakdown and guide about how to use the 'Creatives' section of the Pint platform.
The Top Half — KPIs and Creatives to Optimize
The Creatives section has a simple, two-part layout.
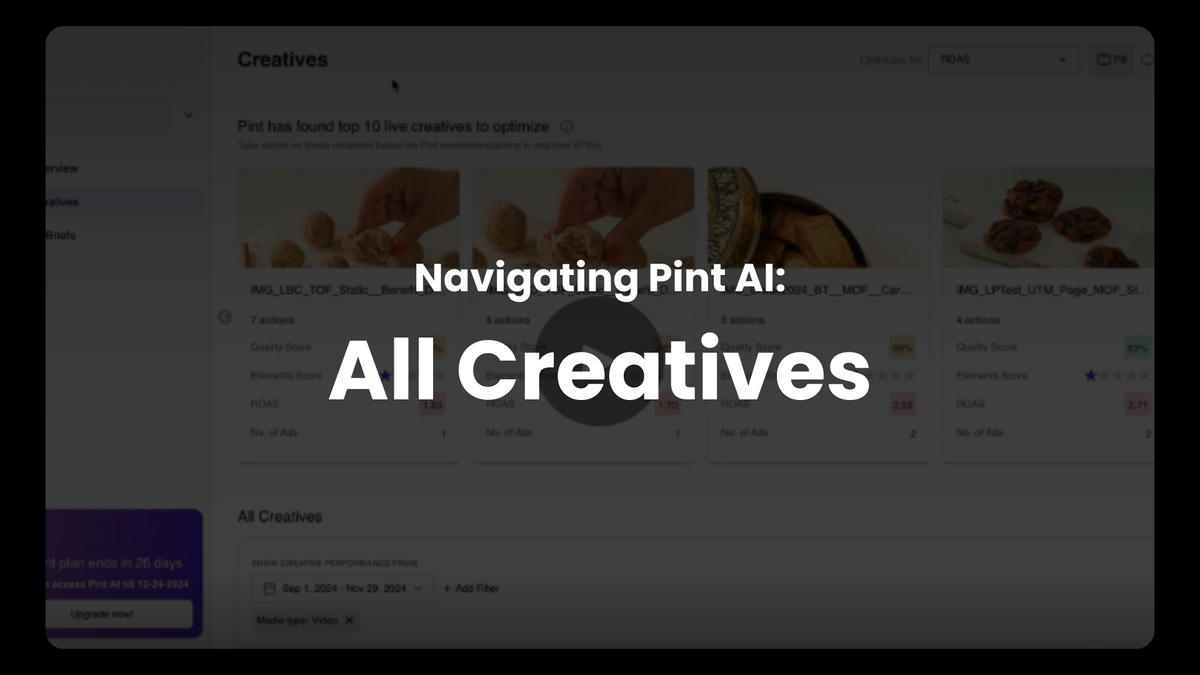
As soon as you land on this page, at the top, you can see a list of creatives to optimize that Pint identifies from your live ones. Based on which plan you're on, you'll be able to see a different number of creatives.
On the top right, you'll see a drop-down to change the KPI you're optimizing for. Changing this will change the results on the rest of the page as well.
Each card, with the respective creative, lists the creative's Element Score, Quality Score, and selected KPI's results. Pressing on each card will take you into that creative's details, where you can see the performance of different elements, the optimization recommendations, the quality recommendations, and much more.
The Bottom Half — Creatives Table
The second half of this section shows you a list of all your creatives in a table format. Here, you can filter through the creatives to find those from a specific campaign, a time range, those with specific results (like ROAS > 2) and much more.
You can add more metrics to the table to get a deeper understanding of the creative's performance. Further, you'll see that some cells for these metrics are colored in. If the color is green, it means that the metric is above the account average, and if it's red, it means it's below the average. Hovering over the metric will show you the result as well as the difference from the average.
And that's it! Put simply, this page is the repository of your creatives.
If you have any more questions or are still confused about anything, write in to us at contact@pint-ai.com


