Pint AI Product Updates: Week 13
A look at our internal testing dashboard

Hello hello!
Things are getting more exciting at Pint AI; we're closer to building out MVP 1.0 and we're progressing at a fast pace.
Today, we're going to show you a peek of our internal dashboard. This isn't our actual front end at all, but is a simple dashboard we built to test out our data pipelines and ML algorithms.
We're using one of our design partners' data for this testing, and we'll soon be reaching out to you to get feedback on our findings.
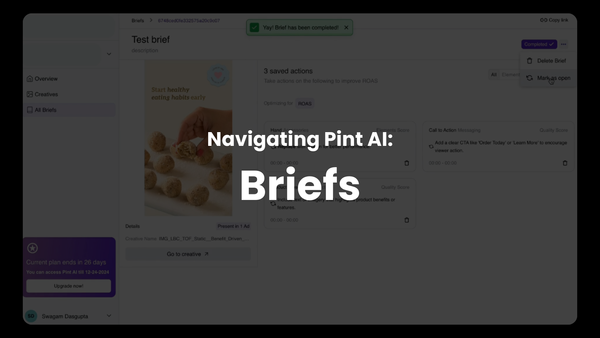
To start with, the dashboard showcases the core engine of Pint AI — the elements.
The dashboard is divided into three simple parts — the context on top, a table with the performance data on the left and all the visualizations (performance analysis, creative analysis and the creatives) on the left.
The dashboard tells you how different elements influence your performance, with the deviation from account average performance.
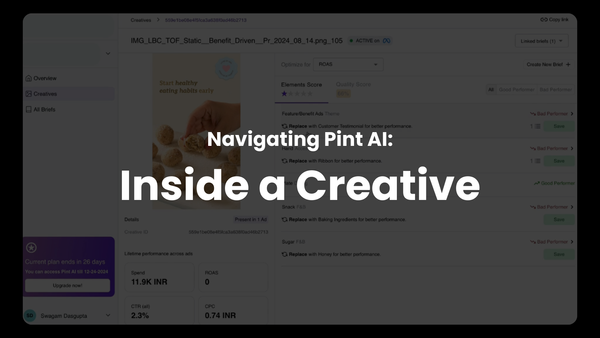
Now, let's take a look at the different kinds of analyses. When I select an element, the analyses on the right start showing.
For starters, here are the different things you can look at under performance analysis:
- Performance by CTA
- Performance by Objective
- Performance by Time
- Performance by Placement
The dotted lines represent the A/C average. For example, for CTAs, we can see that for the element 'Female' which is part of 28 creatives, the impressions (blue) and spend (red) of ORDER NOW does way better than the A/C average, as well as other CTAs of LEARN MORE and SHOP NOW.
The next is creative analysis. Here, you can ask different questions that help figure out how to use this element for best performance. You can look at:
- Quadrant Position
- Format
- Temporal Position
- Resolution
- Element Size
- Video Duration
Here, we can see that for all the videos that have the element 'Female' present, short videos (between 15-30s) far outmatch the long videos (45-60s) as well as very short videos (less than 15s), in terms of impressions and clicks.
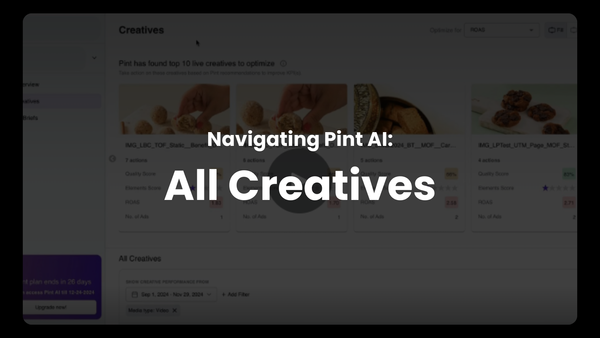
Finally, you can look at all the creatives that have this element.
In addition to this, for all the static images, you can see a list of all the elements that this creative has.
For the video creatives, you can see all your elements along with when all they appear during the course of the video. From this, we're working on seeing how these elements match with the audience drop-off and retention rates.
Here is a video ad with the element 'female'. Along with this element, you can see all other elements as well as when they appear in the video and for how long. We will be working on adding audience retention and drop-off information as well, so you can experiment with which elements can hold audience interest longer.
So all of what you've seen is the core aspect of our element analysis. There's more work to be done on this, and we'll be working to refine the algos, take into account outliers and figure out if we're missing any information to make these findings more valuable.
We would be grateful for any advice and feedback based on the videos above. From the week of 29th July, we'll be reaching out to take you through the dashboard properly, to dig into what can be improved in terms of the information you want to see.
Until next time!
Sourya Reddy
Co-founder, Pint AI